The Magic Pages customer portal just got a new addition – well, to be fair, something got added in again that I had to remove in the past: website monitoring.
A few months ago, I have already added a previous version of this monitoring, but the performance wasn't good. Uptime checks were missed, and overall it became more of a burden than an actual benefit.
However, a few weeks ago, I stumbled upon Checkmate, an open source monitoring tool:
It was easy to set up, promised to run 1000s of monitors on standard hardware, and had an actual API I could query.
In the past, I never found a tool that solved all three of these. So, for a while now, I've had this monitoring system running in the background, for the Magic Pages internal sites. Around a week ago, I then built the backend implementation for the customer portal, and moved Checkmate onto its own dedicated hardware.
Today, I'm making it available to you too. You can now see your website's performance and availability in real-time, right from your customer portal.
The system monitors three main things:
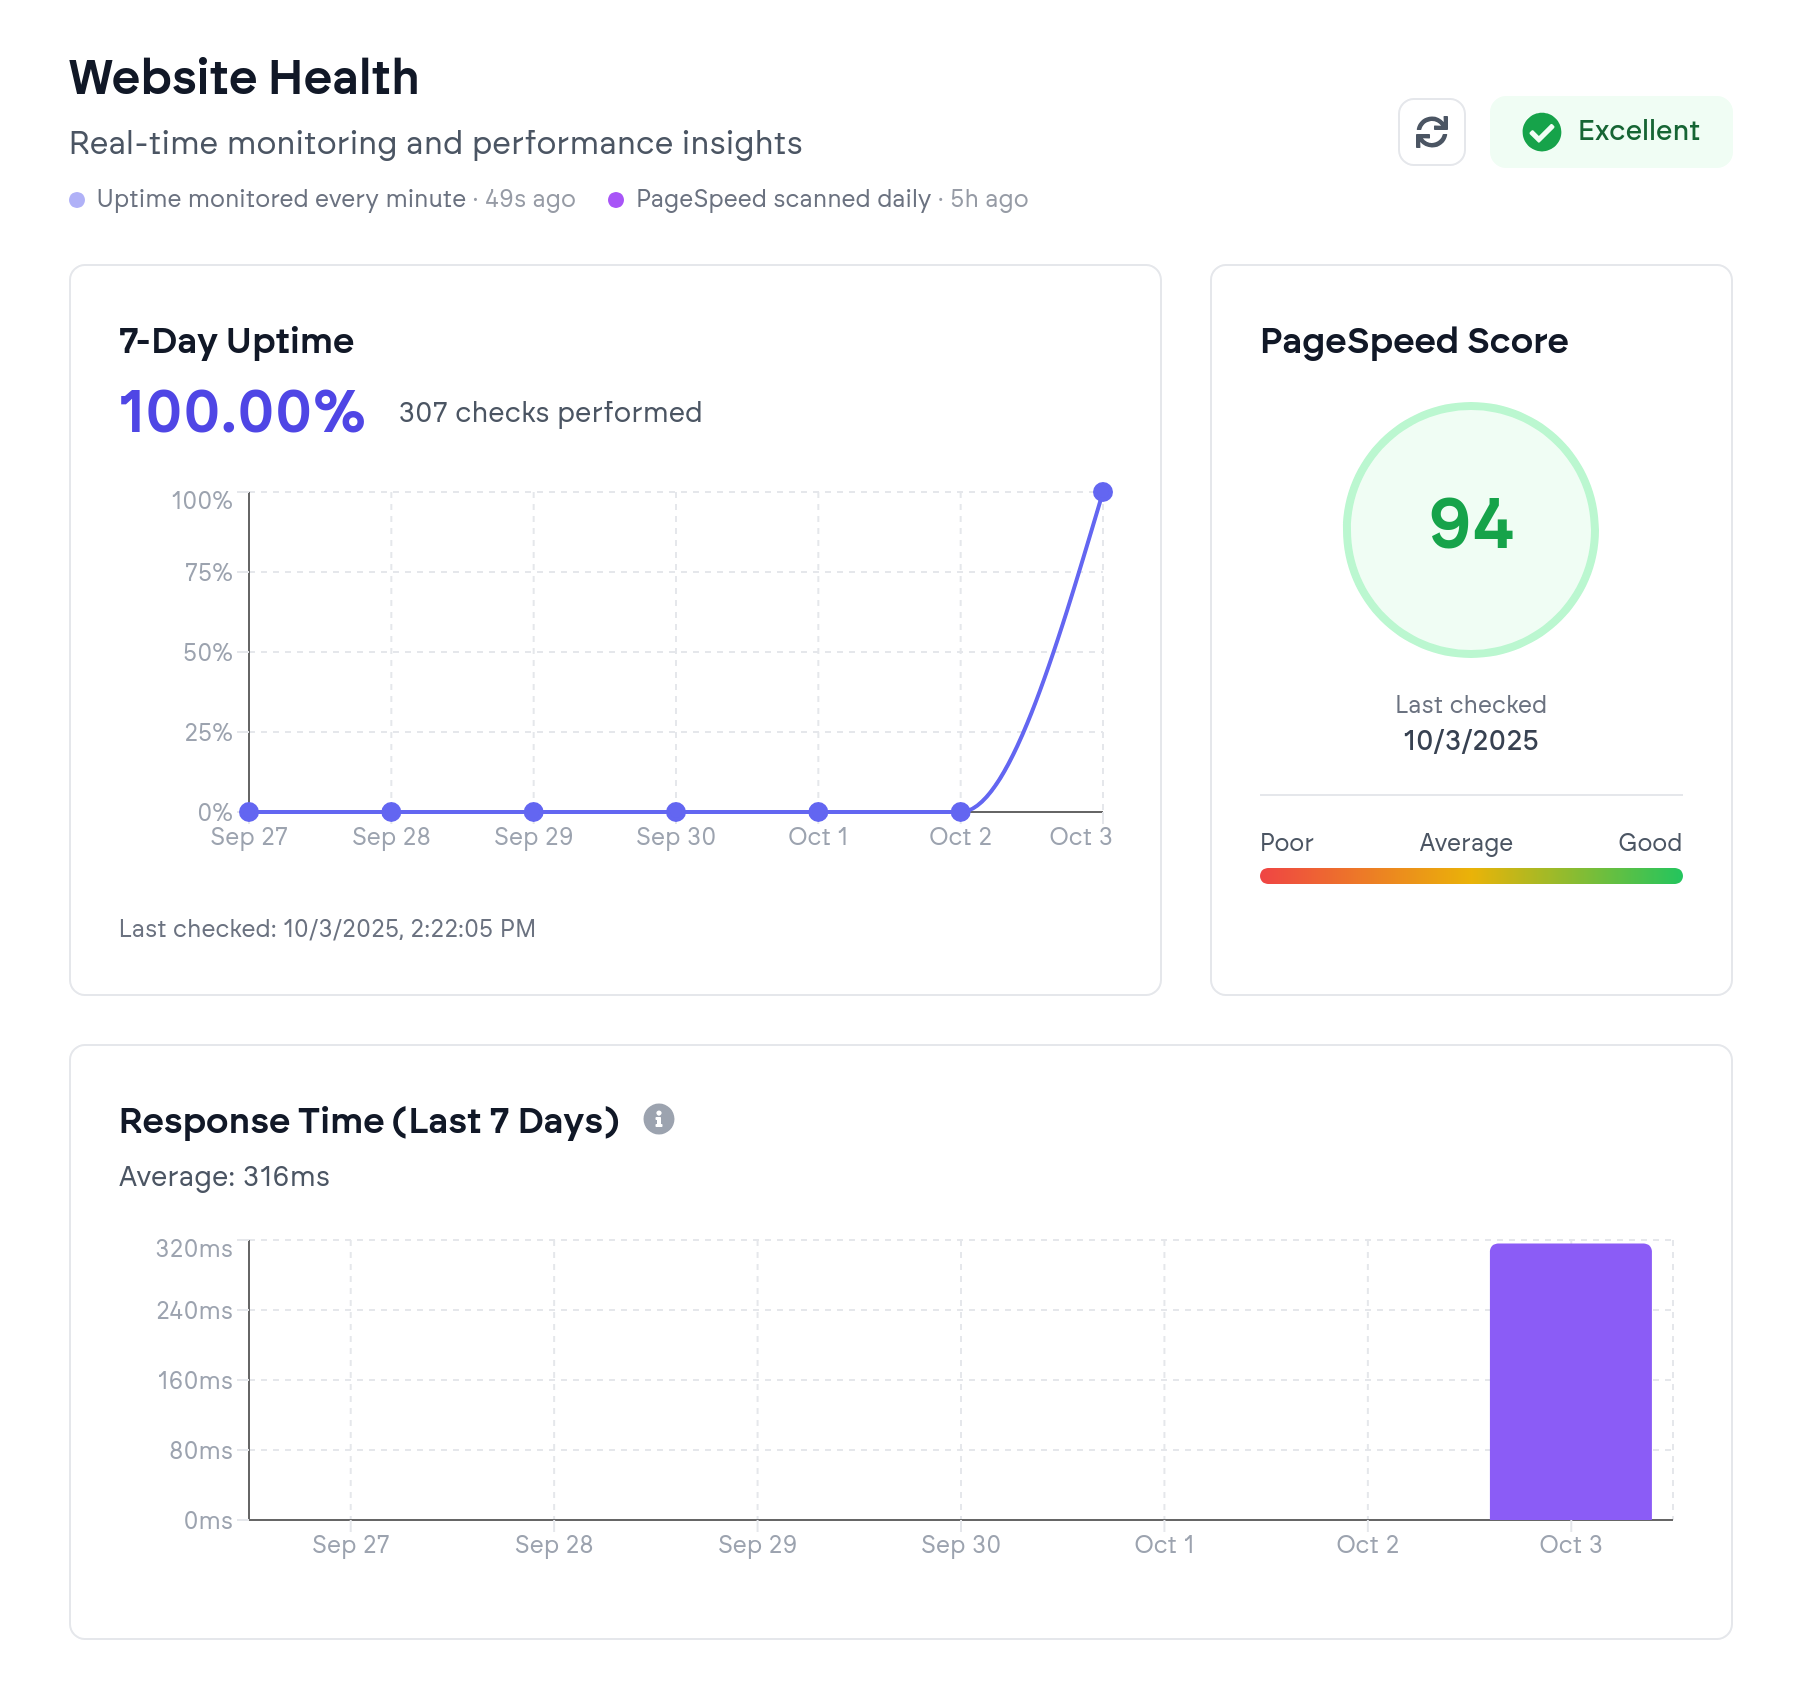
Uptime Monitoring Your site is checked every minute to ensure it's accessible (if it's not, I get a notification on my phone immediately). The dashboard shows your 7-day uptime trend with a clean line chart, making it easy to spot any patterns or issues at a glance.
Response Time Tracking Beyond just being up, your site needs to be fast. The monitoring system measures how quickly your site responds to requests and displays both average response times and a 7-day trend. You'll know immediately if something's slowing down your site.
PageSpeed Insights Daily PageSpeed checks give you a performance score, so you can track improvements or catch regressions early.
If there are any metrics you are missing, let me know. I can always see if that is something Checkmate can provide.